Weekly WIFO Economic Index
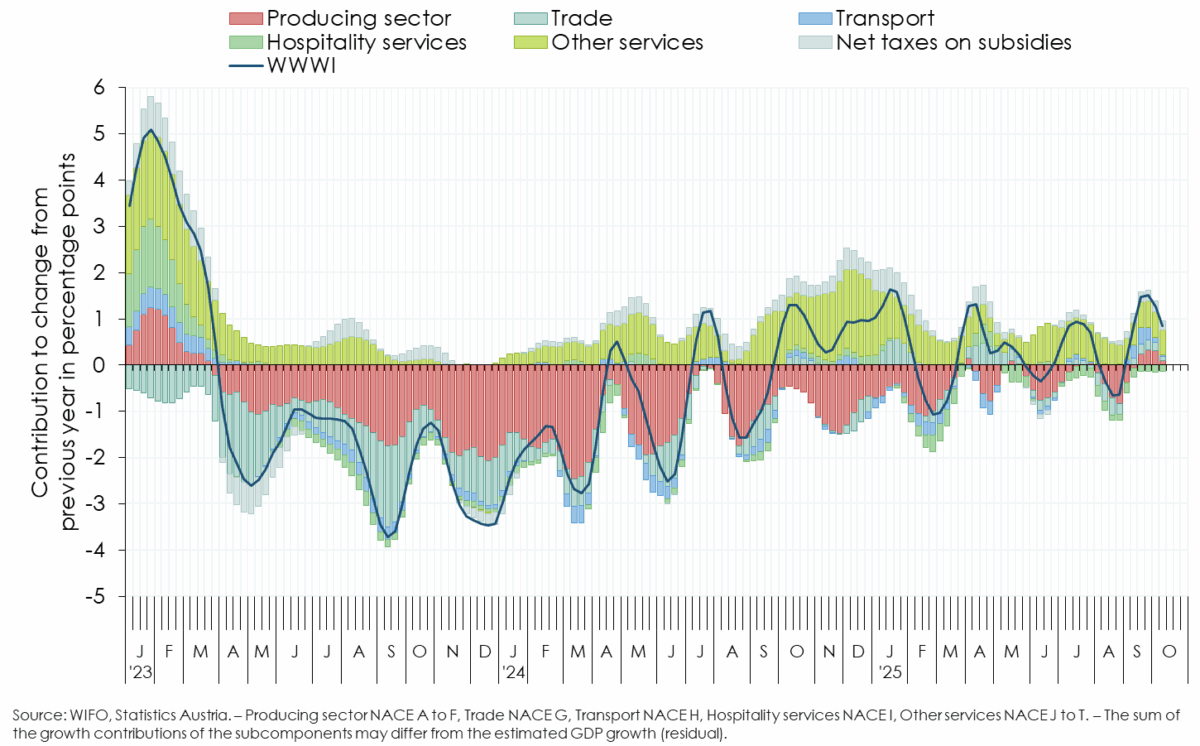
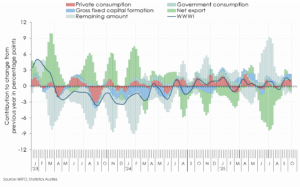
WWWI for GDP and its subcomponents
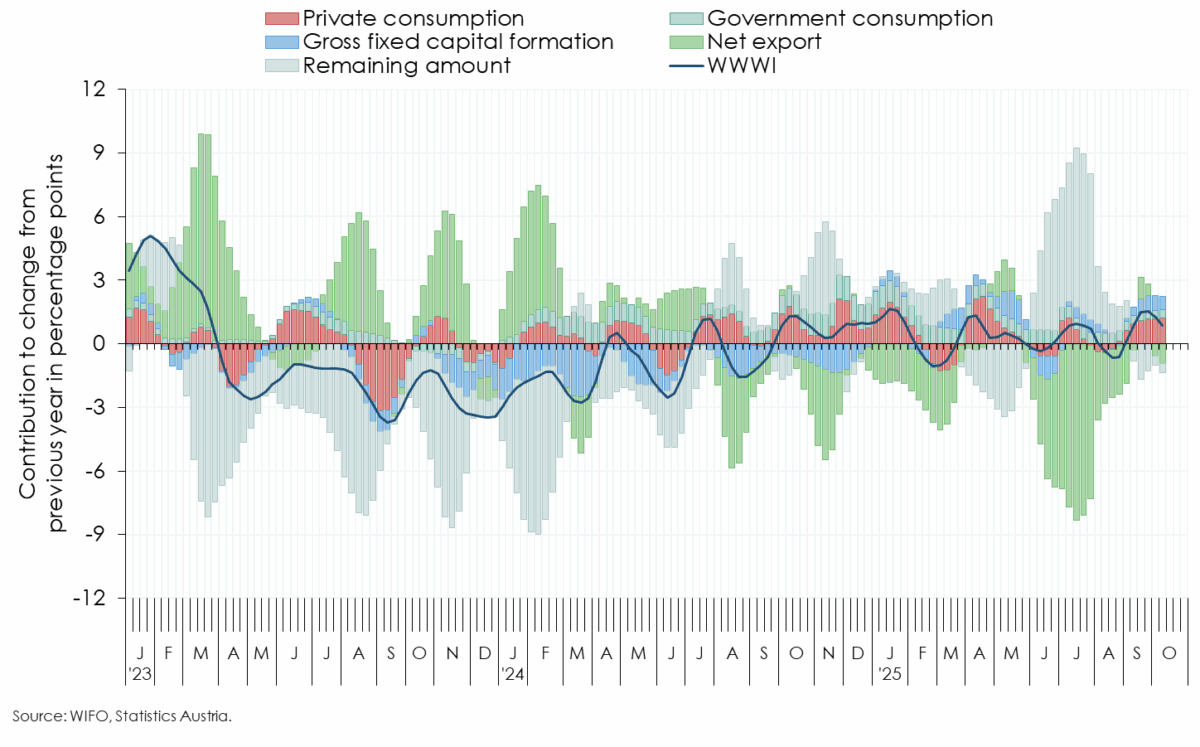
Based on the weekly indicator for GDP (WWWI), unadjusted domestic economic output fell ½ percent year‑on‑year in August (calendar weeks 32 to 35) and rose 1 percent in both September (calendar weeks 36 to 39) and the first half of October (calendar weeks 40 to 41; July +¾ percent, revised)1.
The inflation-adjusted volume of cashless transactions, serving as an indicator of household consumption expenditure, showed a year‑on‑year decline in demand in August and a rise in September and early October. The demand rise appears stronger for services than for goods (retail sales). Private consumption is estimated ½ percent lower in August and about 1¾ percent and 2¼ percent higher in September and the first two October weeks respectively (July +1¼ percent).
Gross fixed capital formation is driven by estimated output (industrial production) and by sentiment in manufacturing from the WIFO-Konjunkturtest (business cycle survey). Investment likely rose by ½ percent in August and 2 percent in September year-on-year (July +1½ percent).
Developments in industrial production and tourism, together with major demand components and their effects on foreign trade, imply that net exports in the broad sense made a negative contribution to GDP growth of 2½ percentage points in August and ¼ percentage point in September (July –7½ percentage points).
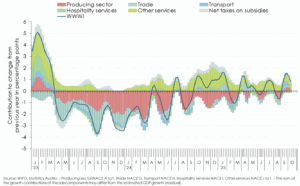
Truck traffic on Austria's motorways and air passenger volumes at Vienna Airport increased year-on-year in August and September, while freight handled at Vienna Airport fell in total. The marked rise in rail freight in September likely reflects lower freight volumes in September 2024 due to flooding in Lower Austria (closure or diversion of the Westbahn line). Transport firms have assessed the current business situation more negatively again since August, according to the WIFO-Konjunkturtest. On this basis, value added in the transport sector (NACE 2008, section H) is expected to be up ½ percent in August and 5¼ percent in September year‑on‑year (July +1¼ percent).
Employment in the goods-producing sector (NACE 2008, sections A to E) continued to decline because of the recession. The year-on-year increase in unemployed, which showed double digit rates between November 2023 and June 2025, has been single digit since July. Current assessments in the WIFO-Konjunkturtest remain largely negative, and the prior improvement trend has again flattened. WIFO expects value added in the goods producing sector to be 1½ percent lower in August and ¾ percent higher in September year-on-year (first half of October +1½ percent, July +½ percent).
Sentiment among construction firms is slowly improving – both assessments of the current situation and expectations have moved into (slightly) positive territory. The number of registered unemployed in construction, after a temporary decline in August, rose again in September. Employment continued to fall, albeit at a slower pace. Value added in construction (NACE 2008, section F) is estimated 3¾ percent lower in August and 1¾ percent lower in September year-on-year (first half of October –1½ percent, July –3¼ percent).
Based on cashless transactions in restaurants and hotels and sentiment indicators from the WIFO-Konjunkturtest, value added in tourism (accommodation and food services, NACE 2008, section I) is estimated 3¾ percent lower in August and 4¼ percent lower in both September and the first two October weeks year-on-year (July –4½ percent). In trade (NACE 2008, section G), value added is expected to have fallen by 3¼ percent in August and to have risen by 1½ percent in both September and the first two weeks of October (July +½ percent).
Based on the current employment situation and the sentiment indicators from the WIFO-Konjunkturtest, value added in remaining market services (NACE 2008, sections J to N) is estimated up 1 percent in August, 1¼ percent in September and 1½ percent in the first two October weeks year-on-year (July +1¾ percent). Value added in other personal services (NACE 2008, sections R to T), based on employment trends and company expectations from the WIFO-Konjunkturtest, is estimated 1½ percent lower in August, 2 percent lower in September and 1½ percent lower in the first two weeks of October (July +¾ percent).
1 The inclusion of newly published and revised monthly and quarterly, which must be taken into account when estimating the WWWI, led to a revision of the WWWI for GDP. The newly published annual National Accounts (30 September 2025) associated revisions for 2021 to 2023 and the consequent revision of the Quarterly National Accounts necessitated revision of all WWWI subaggregates and re-estimation of the underlying econometric models. Notable supply-side WWWI revisions occurred particularly in public administration in the broad sense (NACE 2008, sections O to Q), construction (section F), transport (section H), accommodation and food service activities (section I) and other market-related services (sections J to N).
Weekly Economic Activity, WWWI – Production, WWWI – DemandThe WWWI is under constant development; it is regularly reviewed and will be expanded with new and additional weekly data series as they become available. The WWWI is not an official quarterly esti-mate, forecast or similar of WIFO.
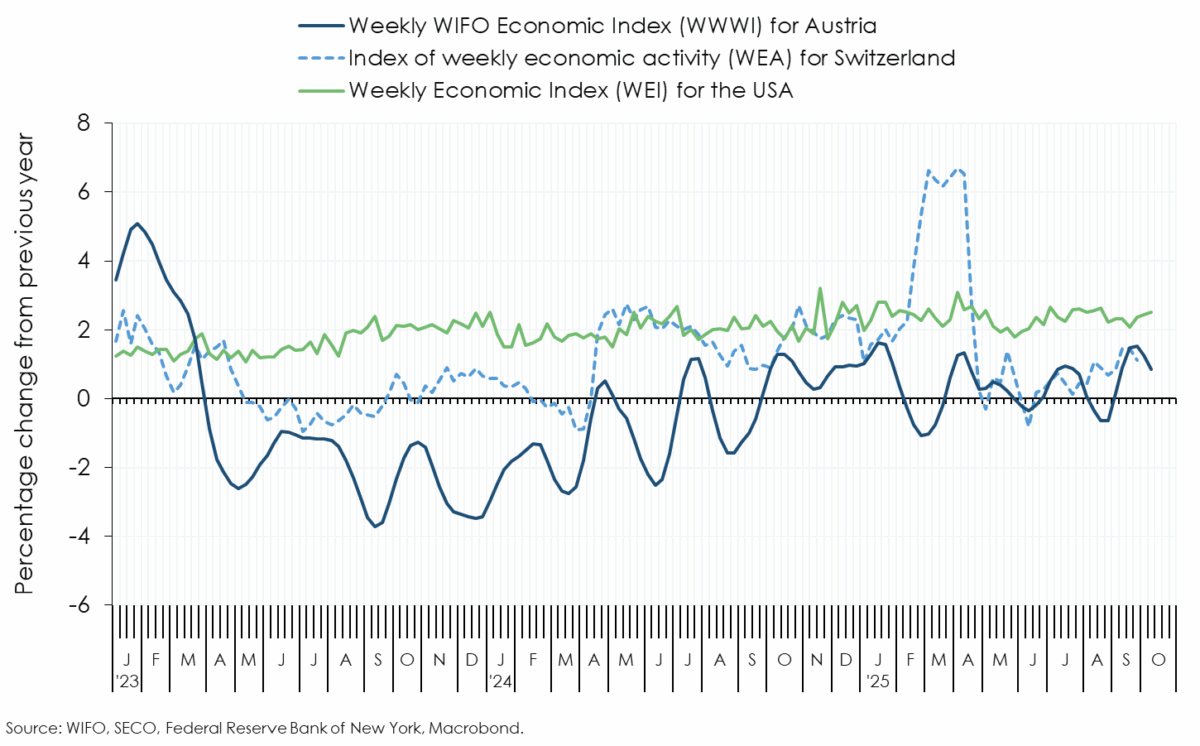
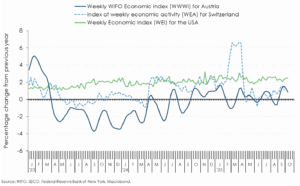
The WIFO Weekly Economic Index (WWWI) is a measure of the real economic activity of the Austrian economy on a weekly and monthly frequency. It is based on weekly, monthly and quarterly time series to estimate weekly and monthly indicators for real GDP and 18 GDP sub-aggregates (use side 8, production side 10) of the Quarterly National Accounts.
With the release for June 2022, the econometric models for the historical decompositions and for nowcasting have been converted to seasonally unadjusted time series. In addition, year-on-year growth rates are now used to estimate the models.
The WWWI estimates are (currently) updated monthly and published on the WIFO website.
Please contact

Further news